
As a beginner trader, understanding the market can be overwhelming. There are numerous tools, strategies, and indicators available to help traders make informed trading decisions. However, using too many indicators can be counterproductive and confusing. Therefore, it is essential to choose a few reliable indicators to get started.
Here are some of the best indicators for beginner traders:
1. Moving Averages
Moving averages are a popular indicator that helps traders identify the direction of the trend and potential support and resistance levels. The indicator calculates the average price of an asset over a specified period and shows it as a line on the chart. The most commonly used periods are the 50-day and 200-day moving averages. When the price of an asset is above the moving average, it suggests an uptrend, and when it is below the moving average, it suggests a downtrend. Moving averages can help traders identify potential entry and exit points and reduce the impact of short-term price fluctuations.
These are trend-following indicators that show the average price of an asset over a specified period of time. They help traders identify the direction of the trend and potential support and resistance levels.

2. Bollinger Bands
Bollinger Bands are another popular indicator that consists of a moving average and two bands that are placed above and below it. The bands expand and contract based on the volatility of the asset’s price, which can help traders identify potential breakouts or reversals. When the price moves towards the upper band, it suggests that the asset is overbought, and when it moves towards the lower band, it suggests that the asset is oversold. Bollinger Bands can help traders identify potential price breakouts and set appropriate stop-loss levels.
These are volatility indicators that consist of a moving average and two bands that are placed above and below it. The bands expand and contract based on the volatility of the asset’s price, which can help traders identify potential breakouts or reversals.

3. Relative Strength Index (RSI)
The Relative Strength Index (RSI) is a momentum indicator that measures the strength of an asset’s price action. It ranges from 0 to 100 and is typically used to identify overbought and oversold conditions. When the RSI is above 70, it suggests that the asset is overbought, and when it is below 30, it suggests that the asset is oversold. RSI can help traders identify potential reversals in the trend and set appropriate entry and exit points.
This is a momentum indicator that measures the strength of an asset’s price action. It ranges from 0 to 100 and is typically used to identify overbought and oversold conditions.

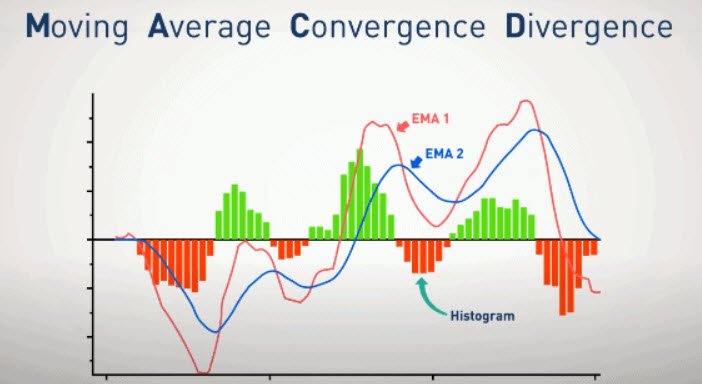
4. MACD
Moving Average Convergence Divergence (MACD) is a trend-following momentum indicator that compares two moving averages of an asset’s price. The indicator consists of two lines, a fast-moving average, and a slow-moving average, and a histogram that shows the difference between the two lines. When the fast-moving average crosses above the slow-moving average, it suggests a bullish trend, and when it crosses below, it suggests a bearish trend. MACD can help traders identify changes in the trend and potential buy or sell signals.
This is a trend-following momentum indicator that compares two moving averages of an asset’s price. It helps traders identify changes in the trend and potential buy or sell signals.
5. On-Balance Volume (OBV)
On-Balance Volume (OBV) is a volume-based indicator that measures buying and selling pressure. It adds volume on up days and subtracts volume on down days, and can help traders identify potential trend reversals. When the OBV is trending upwards, it suggests that buying pressure is increasing, and when it is trending downwards, it suggests that selling pressure is increasing. OBV can help traders confirm trends and identify potential entry and exit points.
This is a volume-based indicator that measures buying and selling pressure. It adds volume on up days and subtracts volume on down days, and can help traders identify potential trend reversals.

It’s important to note that no single indicator is foolproof, and it’s important to use a combination of indicators and other analysis techniques to make informed trading decisions. Additionally, it’s important to practice proper risk management techniques and not rely solely on technical analysis to make trading decisions.
