Cryptocurrency trading can be exciting, but it also requires an understanding of price charts. If you can read these charts well, you’ll have an edge in predicting price movements and making smarter trading decisions.
In this article, we will break down how to read cryptocurrency price charts in a simple and effective way.
Understanding the Basics of a Cryptocurrency Price Chart
A cryptocurrency price chart is a graphical representation of a coin’s price movement over a specific time frame. It helps traders analyze trends and make decisions.
There are different types of charts, but the most commonly used are line charts, bar charts, and candlestick charts.
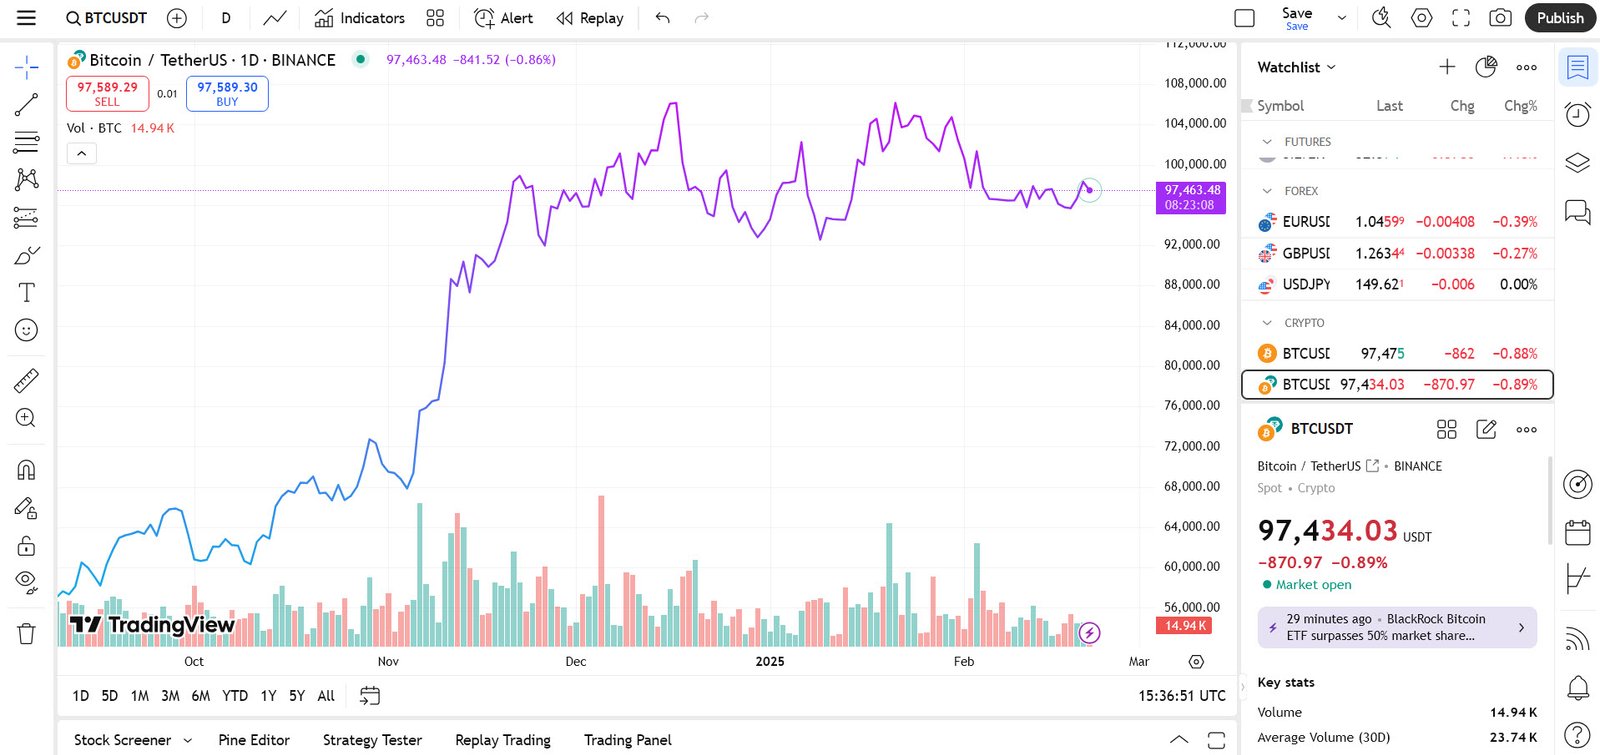
1. Line Chart
A line chart is the simplest type of chart. It connects closing prices over a set period with a line. It’s useful for getting a quick view of a coin’s price trend but lacks detailed information about price movements within the selected time frame.
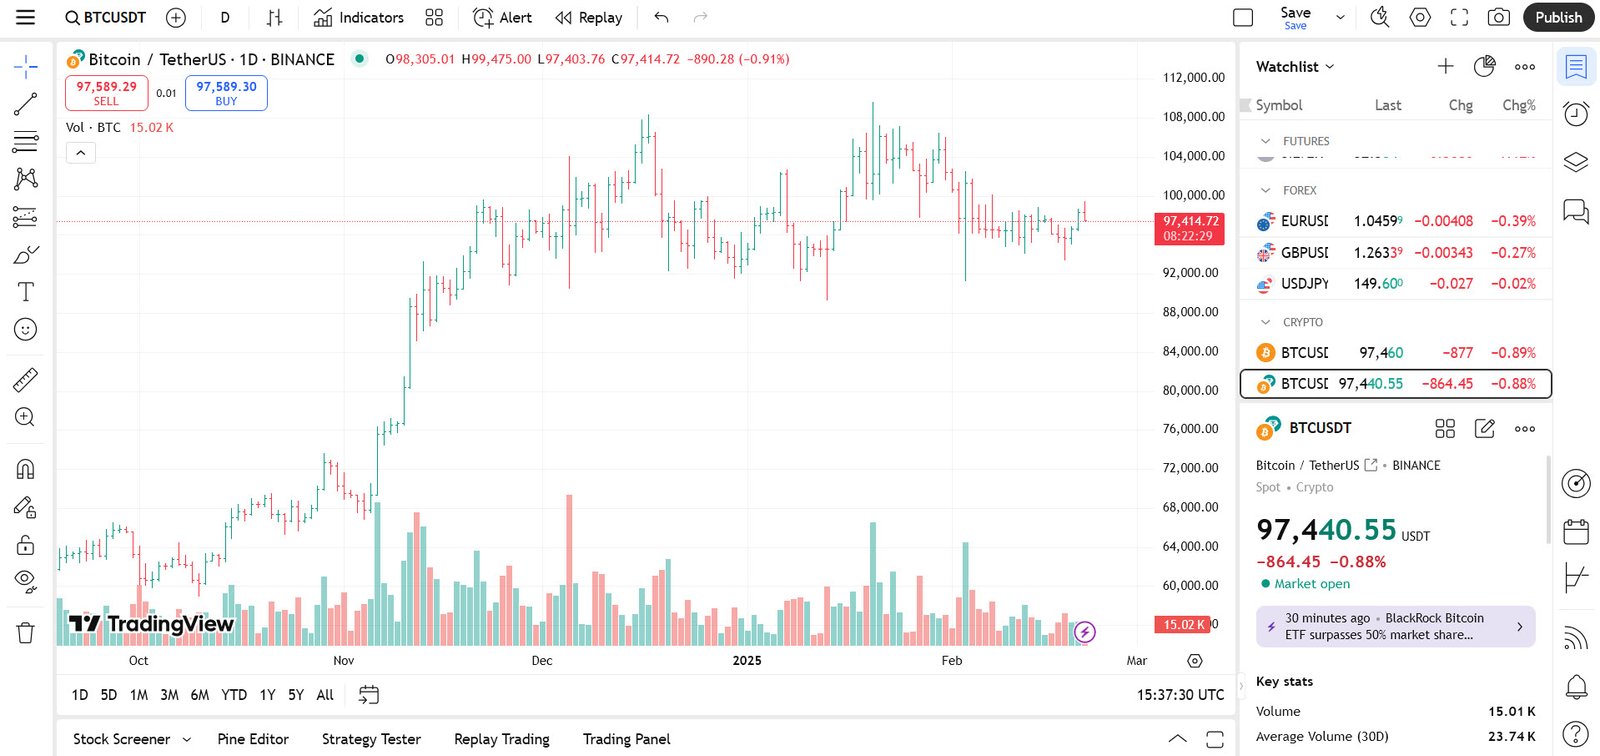
2. Bar Chart
A bar chart gives more details than a line chart. Each bar represents the price movement for a specific period and consists of four points:
- Opening Price: The price at the start of the time frame.
- Closing Price: The price at the end of the time frame.
- High Price: The highest price reached during the time frame.
- Low Price: The lowest price reached during the time frame.
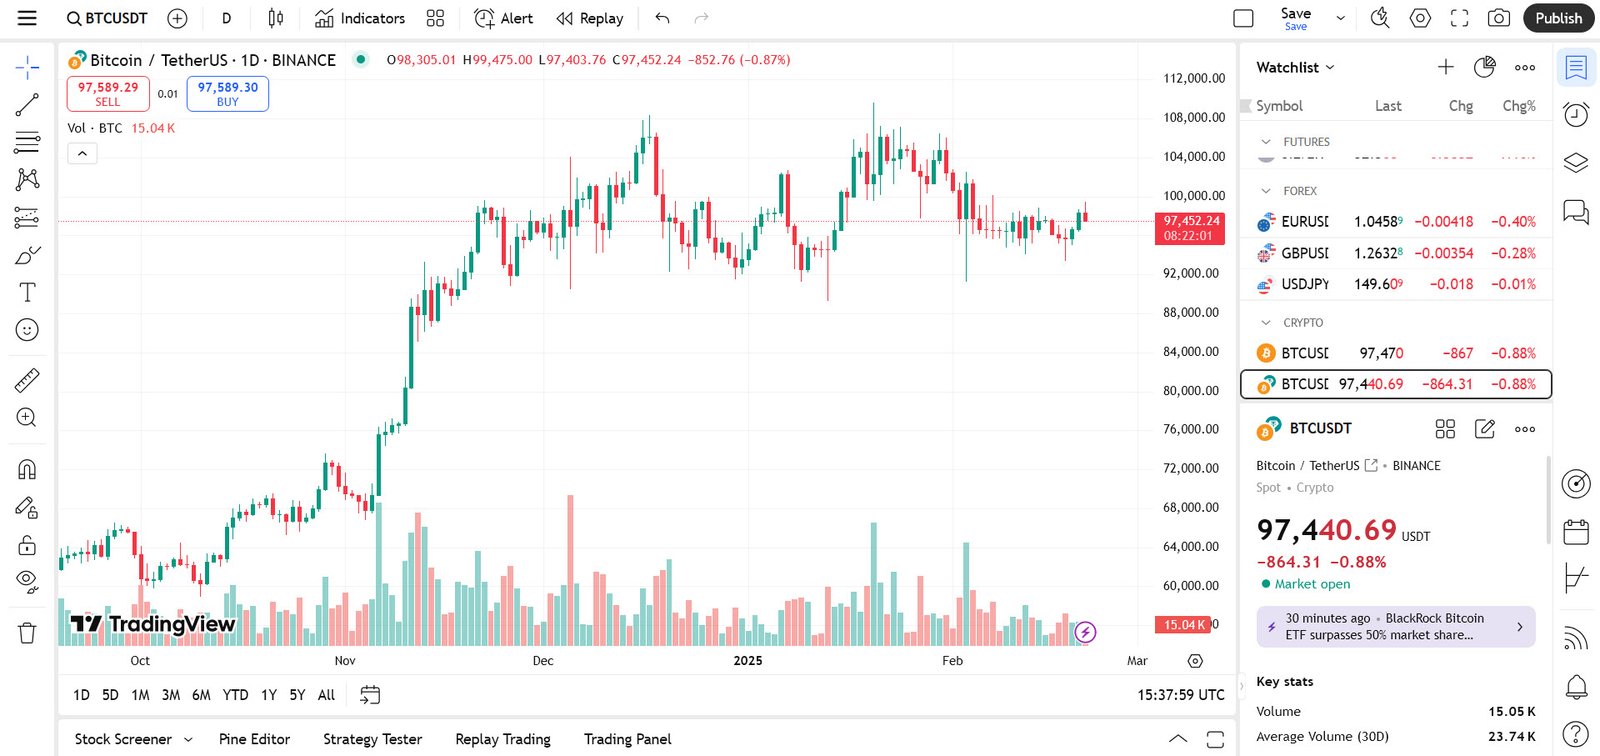
3. Candlestick Chart
The candlestick chart is the most popular among traders because it provides detailed information in an easy-to-read format. Each candle represents a specific time frame (e.g., 1 hour, 1 day) and shows the opening, closing, high, and low prices.
- A green (or white) candle means the price increased during the period.
- A red (or black) candle means the price decreased.
- The body of the candle represents the opening and closing prices.
- The wicks (or shadows) show the highest and lowest prices during the period.
Key Indicators to Analyze Cryptocurrency Price Charts
Apart from understanding different chart types, traders use various technical indicators to predict future price movements. Here are some important ones:
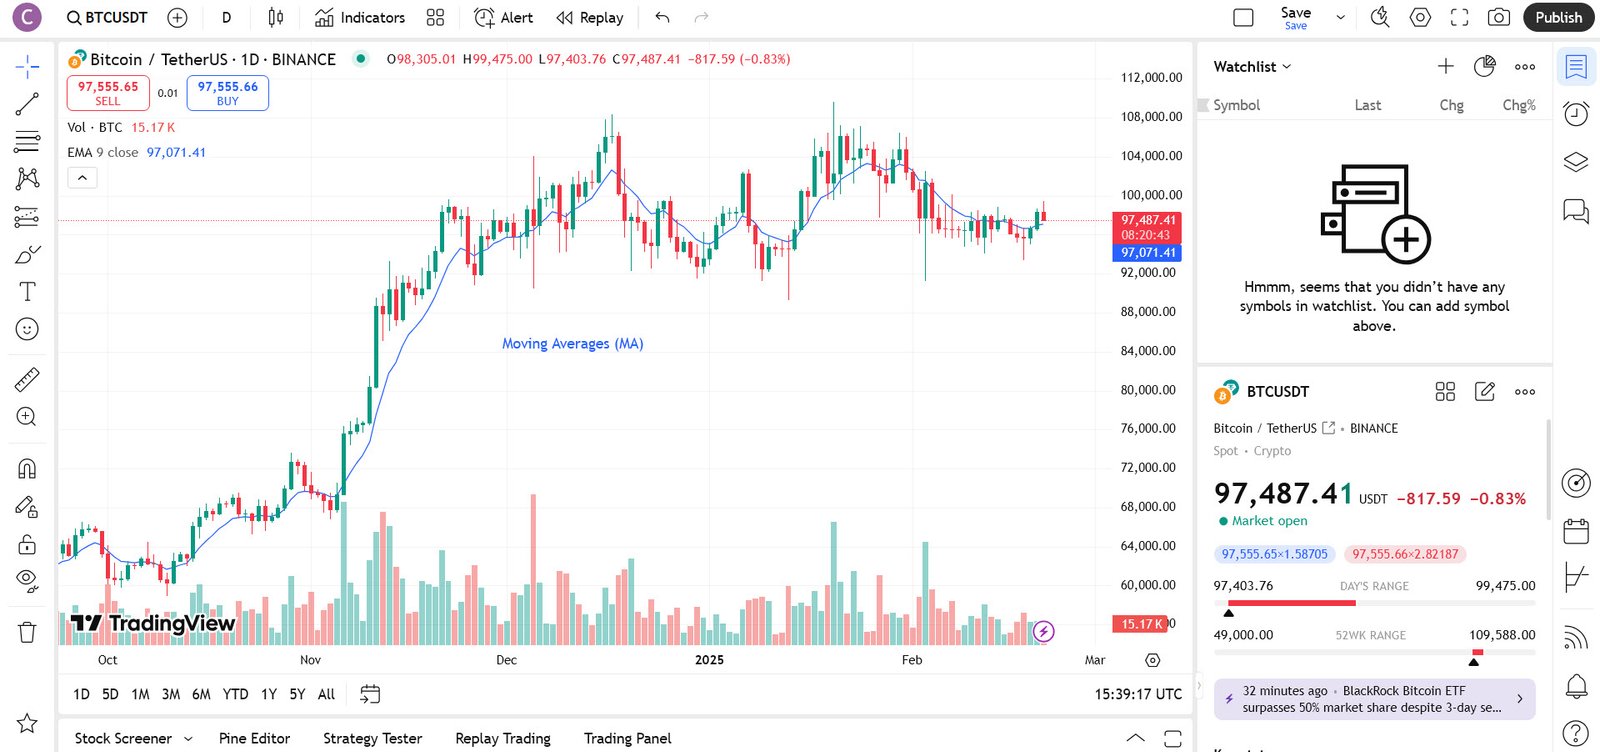
1. Moving Averages (MA)
Moving averages help smooth out price fluctuations and indicate trends. The most common types are:
- Simple Moving Average (SMA): The average price over a specific number of periods.
- Exponential Moving Average (EMA): Gives more weight to recent prices, making it more responsive to price changes.
When a short-term moving average crosses above a long-term moving average, it’s called a bullish crossover (buy signal). If it crosses below, it’s a bearish crossover (sell signal).
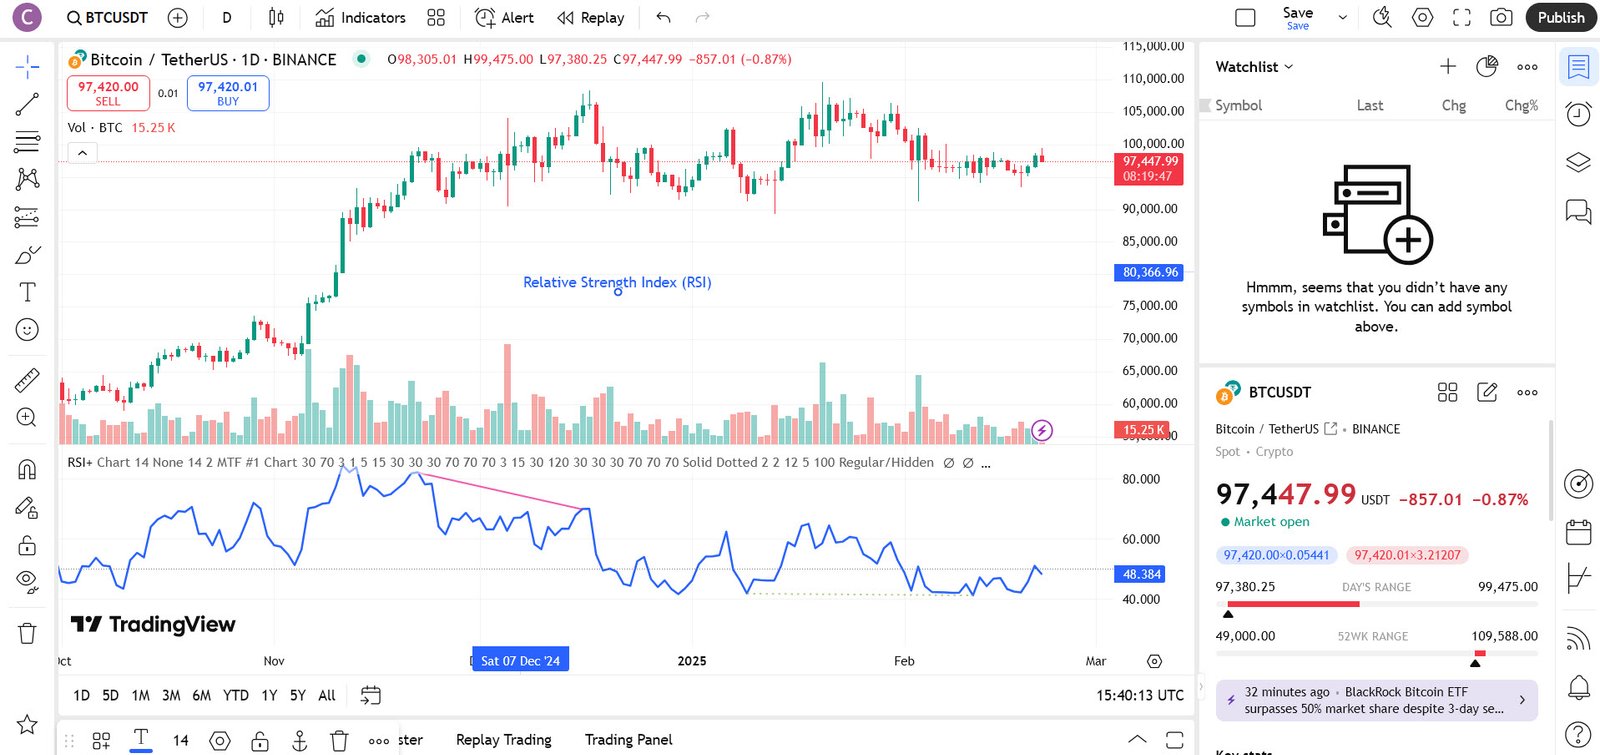
2. Relative Strength Index (RSI)
The RSI measures whether a cryptocurrency is overbought or oversold on a scale of 0 to 100.
- Above 70: Overbought (potential for a price drop).
- Below 30: Oversold (potential for a price rise).
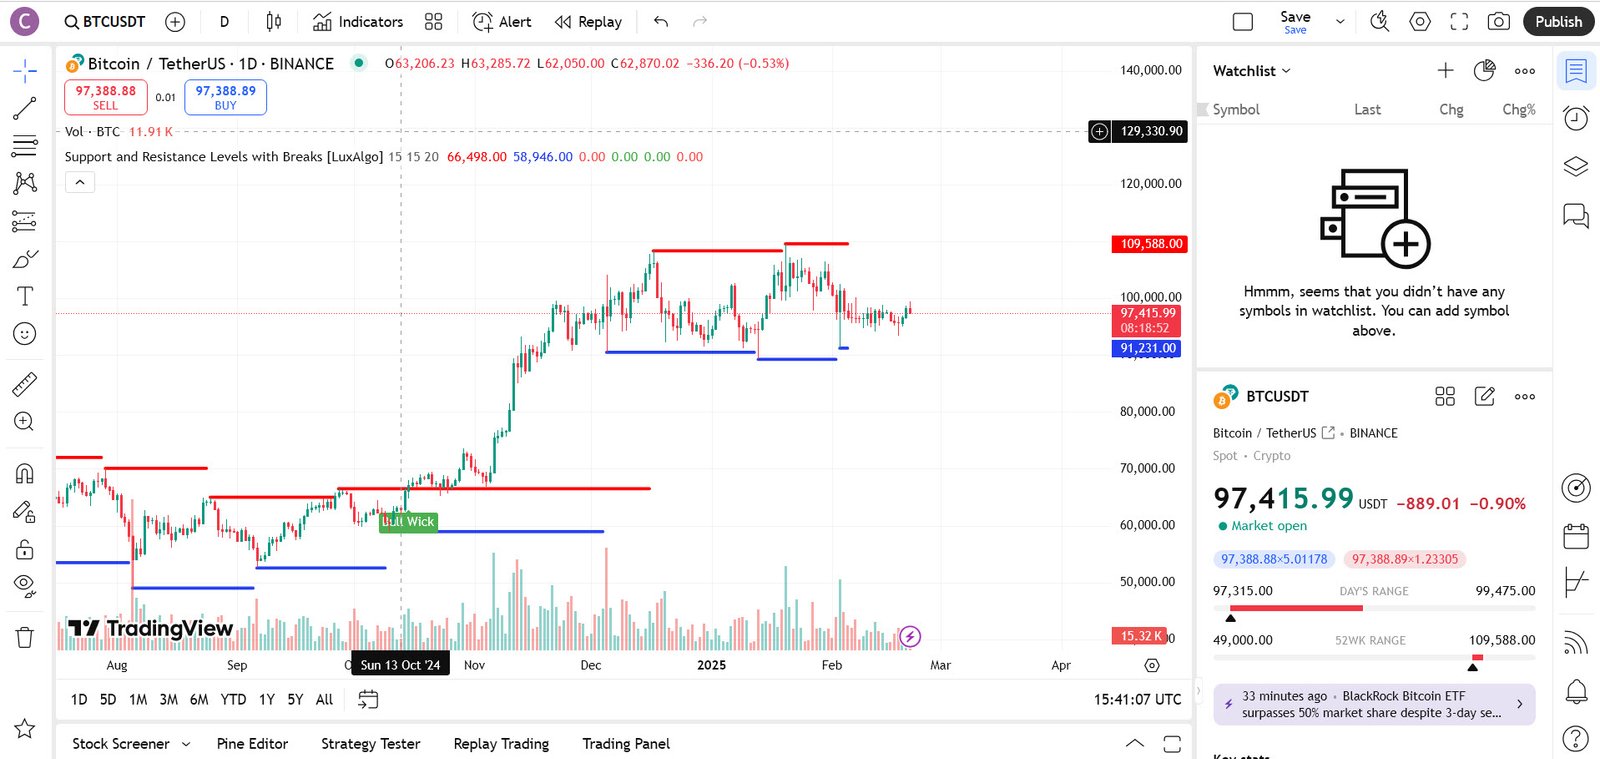
3. Support and Resistance Levels
- Support: A price level where the cryptocurrency tends to stop falling and bounce back up.
- Resistance: A price level where the cryptocurrency tends to stop rising and reverse downward.
If a price breaks through a resistance level, it may continue rising. If it breaks below support, it may keep falling.
4. Volume
Volume represents the number of coins traded during a specific period. High volume usually confirms a strong trend, while low volume may indicate weak momentum.

How to Identify Trends in Cryptocurrency Charts
Traders look for patterns to predict future price movements. The two main types of trends are:
- Uptrend (Bullish Market): Prices are making higher highs and higher lows.
- Downtrend (Bearish Market): Prices are making lower highs and lower lows.
- Sideways (Range-Bound) Market: Prices move within a fixed range without a clear trend.
By identifying trends early, traders can enter at the right time and maximize profits.
Common Chart Patterns
Certain patterns appear repeatedly in cryptocurrency charts, helping traders predict movements:
1. Head and Shoulders
- A bearish pattern indicating a trend reversal from up to down.
2. Double Top and Double Bottom
- Double Top: A bearish signal where the price hits a high twice and then drops.
- Double Bottom: A bullish signal where the price hits a low twice and then rises.
3. Triangle Patterns
- Ascending Triangle: A bullish continuation pattern.
- Descending Triangle: A bearish continuation pattern.
- Symmetrical Triangle: Indicates that a big move is coming, but the direction is uncertain.
Conclusion
Reading cryptocurrency price charts may seem complicated at first, but with practice, it becomes easier. By understanding different chart types, technical indicators, and patterns, you can make better trading decisions. Keep learning, stay updated with market trends, and always trade responsibly.
Happy trading!